Sites rot quietly. A vendor renames a URL, someone deletes a landing page, an image path changes when the CMS is upgraded, a third-party script starts throwing on every load. None of it breaks the build. All of it is visible to users.
Three separate problems, three different ways to find them.
Broken links
On a single page
The Console can do a rough pass, though be careful running this on a site you don't own — it fires a request per link:
const links = [...document.querySelectorAll('a[href^="http"], a[href^="/"]')]
  .map(a => a.href);

for (const url of [...new Set(links)]) {
  try {
    const res = await fetch(url, { method: 'HEAD' });
    if (!res.ok) console.warn(res.status, url);
  } catch {
    console.error('failed', url);
  }
}CORS is the real limitation. A cross-origin HEAD from the page context will often fail even when the URL is fine, so you get false positives on exactly the external links you most wanted to check.
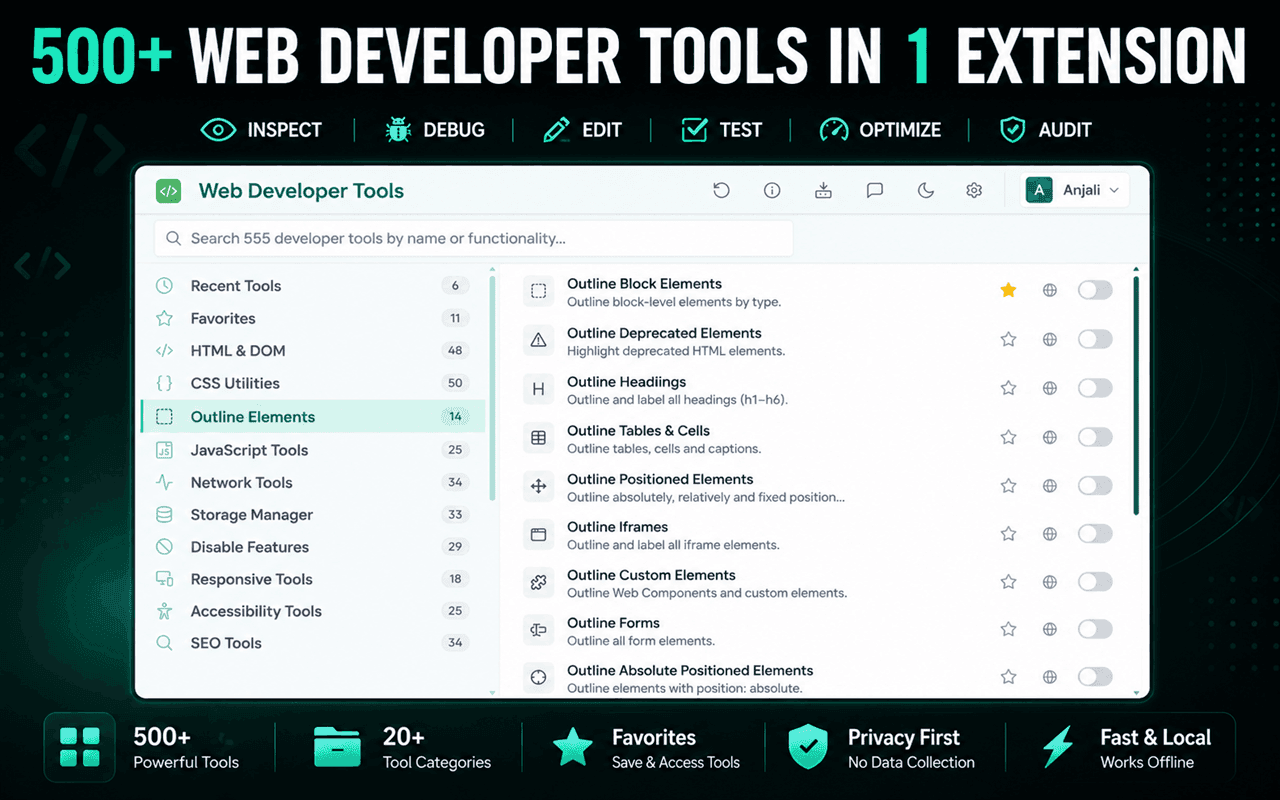
The Broken Link Checker in Web Developer Tools works around that by validating from the extension rather than from the page, then reporting the results in a sortable table. Its companion Link Statistics lists every link with anchor text, target and rel attributes, which is worth having even when nothing is broken.
Across a whole site
For a full crawl you want a dedicated crawler. Screaming Frog's free tier handles 500 URLs; wget --spider -r works if you'd rather stay in a terminal. Google Search Console's Pages report shows 404s that Google has actually encountered, which is a useful signal because it tells you which broken URLs have inbound links.
The links people forget to check
- Links inside the footer, which nobody has looked at since launch
mailto:addresses for people who left- Anchor links (
#section) pointing at IDs that were renamed - Links in old blog posts to vendor documentation that has been reorganised
- Redirect chains that still work but take three hops
- Links in emails and PDFs, which no crawler on your site will find
Missing and broken images
Broken images are sneakier than broken links, because a broken image often looks like an intentional gap. If the image has empty alt text and a container with a fixed height, nobody notices until a customer mentions it.
The reliable test is the naturalWidth check, since a failed image still exists in the DOM:
[...document.images]
  .filter(img => img.complete && img.naturalWidth === 0)
  .forEach(img => console.warn('broken:', img.currentSrc || img.src));
WDT's Find Broken Images does this across the page and lists what failed, which saves you pasting the snippet into every tab. It sits next to Display Alt Attributes, Outline Images Without Alt and Display Image Dimensions in the Image Utilities category, so an image sweep is a handful of clicks.
Also watch for images that load but shouldn't count as working:
- CSS
background-imageURLs that 404 — invisible to any DOM check, so you need the Network panel srcsetcandidates where one variant is missing but the fallback loads, so it works on your screen and not on a retina one- Lazy-loaded images that never enter the viewport because a container has zero height
- Images blocked by CSP or by an ad blocker, which look identical to a genuine 404
- Mixed content: an
http://image on anhttps://page, silently blocked
Page errors
JavaScript errors
Open the Console, reload, and read what's there. Then do the part people skip: interact with the page. Most errors happen on click, on submit, on scroll — not on load.
Errors worth taking seriously even when the page looks fine:
| Error | Usual cause |
|---|---|
Uncaught TypeError: … of undefined | Data arrived in a shape the code didn't expect |
Unhandled promise rejection | A fetch failed and nobody caught it. Silent for the user, broken for the feature. |
Refused to load … Content Security Policy | A CSP that's stricter than the page's actual needs |
Blocked by CORS policy | Missing Access-Control-Allow-Origin on the API |
Mixed Content | An http:// resource on an https:// page |
ResizeObserver loop limit exceeded | Usually noise, occasionally a real layout thrash |
Unhandled promise rejections deserve their own mention. They don't stop execution and they don't produce a visible error, so a feature can be quietly failing for months. WDT captures them specifically with Unhandled Promise Rejections, alongside View Console Errors and a JavaScript Error Timeline that shows what has been thrown since page load — useful when an error scrolls out of a busy console.
Failed network requests
Filter the Network panel by status. A 404 on a stylesheet, a 500 on an API call, a request that hangs and times out. Enable Preserve log first, or a redirect will wipe the evidence.
WDT's Find Failed Resources lists failed and blocked requests without the panel, and Find Slow Resources flags anything taking over a second, which catches the API call that technically succeeds but makes the page feel broken.
Errors you only see in production
A few categories never show up locally:
- 1CSP violations — your dev server usually has no policy
- 2Third-party script failures — the tag manager isn't loaded in development
- 3Ad blocker interference — worth testing with uBlock Origin enabled at least once
- 4Service worker serving stale assets — the classic "works after a hard refresh" bug
- 5Cross-origin failures — dev proxies hide CORS problems entirely
A fifteen-minute sweep
Run this on your top few pages after any significant deploy:
- 1Open the Console and reload with Preserve log on
- 2Interact with the main flows: navigate, filter, submit, open a modal
- 3Filter the Network panel to 4xx and 5xx and read the list
- 4Run a broken-image check
- 5Run a link check on the page's own links
- 6Scroll to the footer, which is where the oldest links live
- 7Do the same on mobile width, since some assets only load there
It's not a substitute for monitoring. It is, however, roughly what a user's first bad experience looks like, and it takes less time than reading the ticket they'd file.
Stopping the rot
- Add a link check to CI for internal links, which are the ones you control
- Fail the build on console errors in your end-to-end tests
- Log 404s server-side and review them monthly, with the referrer attached
- Report client-side errors to something like Sentry, including unhandled rejections
- Add a rule that any deleted URL gets a 301, not a 404
The last one prevents more damage than all the checking. Broken links are cheap to avoid at delete time and expensive to find later.
Images deserve a closer look than a pass/fail check — analysing images on a page covers sizing, formats and lazy loading. And this sweep is one section of the larger pre-launch QA checklist.